
The problems of large J2EE applications
The problems of large internet applications J2EE can be generally divided into two categories. The first consists of problems connected with the implementation of systems, the second – the problems that occur during use and maintenance of systems. A lot has been already said and written about the implementation of large systems, I will focus exclusively on the second group of problems, rarely mentioned in the literature. My article will be based on my experiences gained in e-point company, concerning solving problems of maintaining and using big internet applications.
At first let's define, what is "large system".
The basis criterion is the volume of users, transactions and data. If one of the elements is big, then we can talk about large system. Usually, although not necessarily, there is also some level of system logic complication in large systems, so called business logic. Sometimes the size of the system is perceived through the functions it serves the final user. However, I don't think it is right. Google as a search engine is a good example to prove it, as its interface offers users little functionality but surely we can't say it is small system. And finally: large system can be defined as business-critical for a client, i.e. its failures cause notable financial loss.
Now, let's think, in which areas can occur problems in large systems.
First of all, they can lie in the code of the application. The second type of problems concerns software application, which our application has to use. These are problems occurring in http servers, application servers, data base, MQ systems or outside systems, with whom or system communicates. Another areas of problems are operational system and network protocoles, where can also hide some surprises, and of course also hardware, on which everything operates, can also be a source of problems.
The number of errors is falling according to the presented hierarchy of system elements – the most of errors is in an application, the least in hardware. However, the closer to the hardware the problem is, the more serious and harder to solve it becomes.
When we know, where the problems can occur, lets see, what can hurt us.
The first thing is the system stability. Users expect that in longer period of time a system will be carrying out certain business functions, bringing potential benefits. The unstable working system automatically causes distrust of final users, and at the same time is a reason for losing credibility of system owner.
The next thing is performance. It is differently viewed from the point of view of final user than from the side ordering the system. The final user expects mostly the fastest response time. On the other hand, the side ordering system will expect mostly throughput, so the highest number of business transactions in time unit. Therefore, I propose to assume that the performance means some kind of throughput of the system with the accepted response time.
There is also something called system availability, describing how long the system is available for users. It is connected mainly with the stability and performance.
And two additional aspects: security, whose importance is obvious, and system administration. There are systems built is such a way that unables administration. With some system scale and load, or large number of servers, clusters etc., the administration of such system can be difficult, and costs of its maintenance extremely high.
Comparing these two aspects, i.e. the areas of problems and its features, we get quite a big map of problems (Illustration 1).
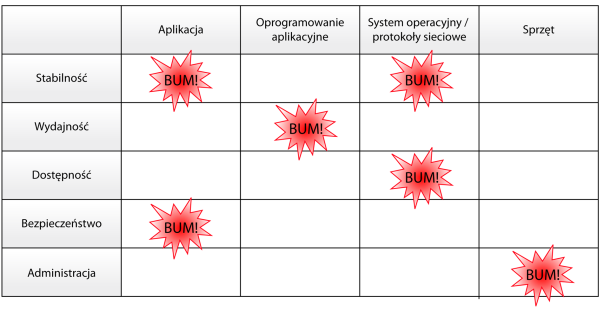
Illustration 1. The area of problems
It is impossible in such a short article to discuss the whole aboved mentioned map of problems. Therefore I will present three problems I came across in e-point.
I would like to begin with something gentle, that is problems concerning concurrency of applications.
Assume that we have the system, which works stable for a few months after implementation. Constantly there is more and more users, and the load of system elements is bigger as well. However, it works without bigger problems. Till one day. The growing number of users causes the appearance of some problems – the system freezes for couple of seconds, sometimes for couple of minutes. Some of these cases end with the total "death" of the system and we must to restart the computer. However, what is important, during such "death" we can observe quite a big drop of load on the processors, and we don't see a lot of operations I/O, neither in the data base nor on the application server.
We begin to observe in the application server – specifically in logs of the application – exceptions with deadlocks, so the information which is indirectly returned by JDBC driver, that the data base detected a deadlock of transaction which had been done, and that the transaction had been rolled back. There are also the exceptions illustrating that JTA transactions on the application server are timing out. The analysis of the situation was not simple, but finally we managed to discover what were the reasons for such condition.
First of all, it turned out that in two particular business transactions we had unfavorable intertwinement of readings and writings. It concerned the operations on the data base. Already this fact could lead to deadlocks, but in this particular case it had to be something more. It was the full scan one of the table in the data base. The table was occurring in both transactions. When we were requested the reading of one record, the optimizer considered it is necessary to scan the whole table. Logically the operation of the optimizer was correct. However, from the point of view of performance it caused drastic drop of concurrency, which caused blocking of the key transactions.
When we discovered the cause of the problem, it was not difficult to solve it. Together with changing the application and uploading on the product system it took us several hours. However, the analysis itself and looking for the cause of the problem took us several days.
The solution was simple. We moved the modifying operations at the end of these transactions, which was possible from the point of view of business requirements. Then we prepared a special hint for data base optimizer which caused that the preferable way of access to the table was the use of index, not the full scan of its content.
Let's sum up the problems of concurrency.
During studies we were said that when we have problems with deadlocks, we should just block resources in the established sequence, and everything will get back to normal, particularly there will be no deadlocks. Unfortunately, this academic solution works only theoretically and it is difficult to put in into practice, even in small systems. Why? First of all, in a real business system we are dealing with thousands of transactions intertwining each other, and each of them keep some resource – usually till several dozens. And, what is worse, practically we don't have any control over blocking these resources, because usually we operate on the data base. If we want to select/take a line from the table, usually we expect that only this one will be locked. But it does not have to be necessarily true. It can be a page of table as well (lines in the data base take are grouped usually in bigger units of data) or even the whole table. If we have no control over it, it is absolutely not possible to establish any sequence, because that's no use anyway. Sometimes it results also from the business requirements that it is not possible to turn some transactional operations, which actually pins down the academic approach towards the problem.
If it is so, what can we do in practice? We can, above all, test the system with teh help of real business scenarios. The point is to observe the users' activity after implementation of the system, and with the achieved data build business scenarios. In such a way, after introducing changes in the application or after extension of the system, we can carry out certain scenarios in a lab, overloading the system and observing all the parameters of concurrency, i.e. what is happening in the data base and on the application server. Extremely important is also monitoring concurrency parameters systematically during operation of the production system.
Another topic is contact with outside systems. Let me remind that we have the stable, working for 2 years system. There is no performance problems and the users are satisfied. At the client's request we implement a function confirming a transaction via SMS. After the implementation, the system works stable for couple of weeks and suddenly is unavailable for users. On our side, on every element of the system a complete drop of load is visible. In the system nothing is happening, if not to mention front-end http server accepting numerous failed requests. What we can observe is the saturation of threats in the application servers. All threats on the server which could process requests are in use Nothing is happening in logs. What are we trying do do?
Because of the fact that on the first site there is nothing we can draw conclusions from, we decide to restart the system. The system wakes up, but after 2 minutes is dead again. We restart it once again and the same thing happens. What helps is removing SMS module. The system wakes up and works correctly. We know already where is the problem. It turned out that the new functionality breaks something dramatically. After analyzing the situation we found out that the direct cause of the problem was the unavailability of the SMS gate. However the gate did not refused the connection but simply everything wasn't working according to the requests sent by us, which were simply frozen. TCP timeouts on the level of the operational system are very long, so during that time nothing was able to break, so we had no exceptions. The real source of the problem lied somewhere else. It resulted from insufficient separation of our system and the SMS gate. We expected certain separation but it was not sufficient. In our solution, when a user was making transaction, his/her data were to be found in the proper structure in the data base, and additionally the SMS was in a separate table, which then was read and sent by totally asynchronous process. Unfortunately this process caused locking writings to the table with messages, which in case of problems with the SMS gate resulted in freezing of the whole system.
What kind of solutions we can have in this case?
Such problems it is solved usually through the introduction of queuing. It can be for example JMS. Moreover, it is necessary to introduce timeouts with communication with such outside systems. Not only on the logical level, but various, also on the TCP level. However we could not use queuing, so we had to use a trick with the data base. We simply organized an access to the data base in such a way that the reading of messages table will not lock any writings.
Contact with outside systems we are integrating or cooperating with, is the most frequent cause of problems in large systems. Always, when in such interactions a network is considered, a lot can happen. Another examples of such contact points are:
- Data base – very often we think that data base is the integral part of the system, but looking from the point of view of the application it is the same point of contact as in case of backend system or a SMS gate. Therefore we have to configure well appropriate timeouts and half connections parameters, in order to avoid friction during between application severs and the data base.
- E-mail servers – sometimes they are also in bad condition, in their own specific way
- Outside systems – modern built system practically do not exist regardless other outside systems. There is always some other system – smaller or larger – taking part in operation of our system.
- Logging events subsystem – an interesting fact is that it can also give us a hard time. I know an example of application server, which was logging events but when a log was 2GB the server disappeared, i.e. JVM disappeared and was not able to be switched on again. The solution was to clear the log, but it took a lot of time to get to this solution.
It seemed that threats does not saturate so quickly, especially when we have a solution of 10 virtual machines with 50 threats in each of them. It gives us 500 threats waiting to accept the request from the Internet and serve the users. On the other hand when there is simultaneously 100 requests per second served, and individual threats begin to block each other, it is a matter of several seconds, sometimes two minutes that all the threats will be blocked, which will cause a complete freeze of the system.
Summing up the discussion on the problems with outside systems, I would like to focus on the layer of network. It will not happen much here. TCP/IP heaps in operation systems, firewalls, routers, switches, VPN canals for systems, with which we integrate in a way... Everything can stop working and usually in the at least expected moment. What is worse, it can fake to work, which in case of network happens quite often. Additionally there are other damages, e.g. broken wire, which sticks only a bit.
Another topic is memory in application servers as an example of performance restriction. Quite a straightforward example. As usual I begin with the description of the idyll: we have a stable working system for several months, systematically growing number of users, the system is slightly more loaded, but it does not make our life a misery. On the application server there is 70% load of processor. Our client is satisfied. However in moments of increased activity we can observe alarming symptoms. At first the respond time of the system is longer and very often there is maximal load of the processor on the application servers, which sometimes cause the freezing of the system. In logs we do not observe anything unusual, so it seems that they are classic symptoms of the simple system overload. Java simply overload the processor and it should get more power.
In such case we have two methods this classic problem with efficiency of Java. We can optimize it more than already the optimized application, which needs changes in the source code and further tests. Therefore it is a risk but above all it rises further exploitation costs of the system, which is often forgotten. The second solution is adding hardware, which seems easy and unproblematic. It can be done quickly – adding a new machine, installing suitable software, adding a machine to cluster and waiting for positive effects.
We chose the second solution. After adding some new hardware, a significant improvement has been observed, but not such as we expected, so further than linear. We analyzed the problem once again. If Java had been the reason for the overload, we began to observe thoroughly the work of the virtual machine. And what were the conclusions? The cause for the problem was not the low processor performance, but small amount memory for the application, and because of that too frequent activating the garbage collecting process.
Luckily, modern applications have tendencies to allocate a large number of objects that are left for the garbage collector. With every request we create a lot of objects and then we expect that they will be nicely destroyed. In case of the virtual machine, with which we were dealing with, it wasn’t so and the garbage collector had more work to do. Actually, it was the processor which was operating the garbage collection process instead of executing the application code.
Which solution did we use? First of all we extended the physical memory on servers and we set up couple of virtual machines on each of the physical servers. Why so? Why didn’t we, for example, increase the amount of memory on the virtual machine? The reason for that was the 32-bit machine and it was simply impossible to do. On our operation system we could extend the memory heaps only to 1600 MB, so less than 2 GB. As we couldn’t do more, we had to find a different solution.
As it is quite interesting example, I will analyze it in details.
First of all: what is on the memory heap on the application server where our application is installed? Actually, there are two types of objects. Long-lived objects, connected with the application server, users’ session and cache memory, which are not deleted from the memory during the garbage collection process, or it happens very rarely, e.g. for a user’s session. On the other hand we have short-lived objects, so generally all that are connected with every request sent to the server. These objects, practically with every call of the garbage collector are destroyed from the system memory.
What is crucial for the performance of the whole system is the time of work dedicated for the garbage collecting process (Garbage Collector time, GCtime variable) and the time between each call of the garbage collector (Allocation Failure Distance, AFdistance variable, defining how often it is called).
How to define the load of the processor for the application and for the garbage collector? In the first case we take the time of the gargabe collecting (GCtime) and divide it by the sum of garbage collecting time and the gaps between calls of garbage collector (AFdistance), so the total time needed for garbage collecting of memory and normal work (see: Illustration 2).
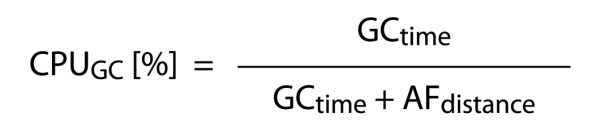
Illustration 2.
In case of the application we have the opposite dependence, so we divide the time the processor spares on the operation of the application (AFdistance) by the time in which the garbage collector is not working (see: Illustration 3).
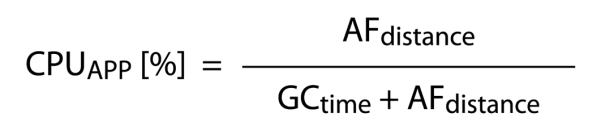
Illustration 3.
When it comes to the garbage collecting time, with rough approximation we can say that it is directly proportional to the size of the memory used by the long-lived objects. At least such a dependency can be observed for the algorithm mark and sweep.
However the distance between particular calls of the garbage collecting process (AFdistance) can be defined by subtracting the size of the long-lived objects (LongLivedObjectsSize) from the size of the heap set on the server (HeapSize) and dividing everything by the product of the number of requests per seond (RPS) and the size of short-lived objects generated by every requests (ShortLivedObjectsSizePerRequest). The dependecy is illustrated below:
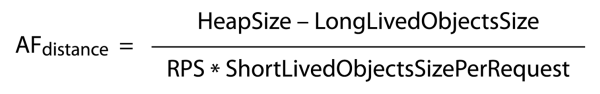
Illustration 4.
Now, let’s go back to the example of our application, which has the 2GB heap. We assume that the application receives requests. In our case, the memory for long-lived objects is about 700 MB, which is less than 1/3 of our heap. For every request there is a bit over 1 MB. We set experimentally that the time garbage collecting time of the 1 MB heap will take 2-3 milliseconds. On the basis of the earlier presented dependency we can set the time the processor uses for application and for garbage collecting process, which is presented on the illustration 5.
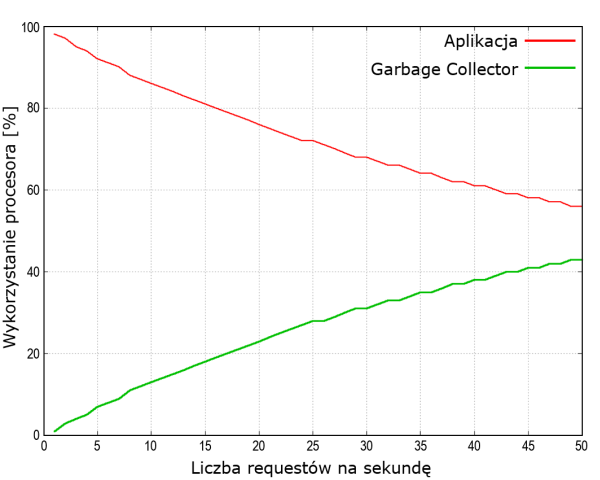
Illustration 5. The time the processor uses for application and for garbage collecting process of memory.
Description: wykorzystanie procesora – the load of the processor; liczba requestów na sekundę – the number of requests per second
With 50 requests the garbage collecting process takes 40% of the processing time, so to put it mildly, there is not much left for work of the application. And the trick is to maximally flatten this curve. If we don’t have possibilities to do anything in our virtual machine (e.g. a change in the garbage collecting algorithm or changing other parameters), we simplest way is adding some additional memory to make the space for short-lived objects much larger. And we did so.
At the end of this article I suggest to take a look on the topic of availability, so the mythical nines...
In some documentations for application servers it is described how to achieve the successive nines – the first, the second...and even the eighth one! We will see if it is possible to guarantee the client these successive nines in practice, and if so – how.
The first nine - availability of the system on the level of 90%. It means 73 hours unavailability in month. So we have a lot of time to repair something or even to buy new hardware in the supermarket and install everything one again, or use a hosting center. To create such a system, the team doesn’t need to have advanced knowledge, and it can be serviced by any administrator. A piece of cake ;-)
Let’s see what will happen if we add the second nine. Well, 99% of availability means a bit over 7 hours in reserve. It gets complicated. Firstly, the hardware from the supermarket is not enough. The necessary minimum we have to guarantee is the standby server, prepared in such a way that it can replace the potentially broken one in the production system any time. Because in fact we don’t have time for reinstalling everything. The next thing is to take care of the effective cooperation of certain system elements, e.g. take into account aspects of concurrency, interactions with other systems, so that everything will compose a whole. And finally: such a level of availability needs to be supervised 24/7. Is it then possible for one administrator to fulfill such task? Let’s assume that it is – there are some that would deal with it alone, but certainly they would need automatic mechanisms for monitoring the system, necessary on this level. However still, despite some difficulties, two nines are not hard to achieve.
Let’s complicate it a little, adding another nine. 99,9% of availability gives us 43 minutes in month for breakdowns. In my opinion, this is the challenge only for professionals. First of all, a redundancy of the hardware and both system and application software is necessary. It means we ha have to guarantee high availability clusters – on http servers, application servers and the data base servers. Naturally, it concerns also the hardware – we have to have guaranteed clustered switches, firewalls, disk arrays etc. What we need is a precise project and a precise implementation of such system, because we cannot afford a bigger breakdown. Another thing is the analysis of the state before breakdown – the system need to be monitored to react quickly in case of any problem. What is important is a permanent prevention and not putting out "fire" in case of breakdown. Additionally, we have to guarantee experienced development and hosting teams, who had dealt with such tasks before. They have to work and monitor the system constantly and react quickly in case on any breakdown symptoms. Moreover we have to equip the administrators with automatized repair procedures and take into account that 43 minutes is a very short time, and when we add stress it turns out that a human cannot do much apart from pressing the stop/start button. However, the implementation of such button in large systems is not easy. Switching off and on again all elements of the system, which works on several dozens of machines and is composed of 100 or 200 software elements, takes usually couple of minutes, even if it’s well built. Moreover, it is required to prepare the system for reconfiguration in the fly. It concerns the application itself as well as its components on which it operates. What’s more? Double monitoring will be needed, preferably monitoring of the monitoring. Although perhaps it is a requirement adequate to the next nine. Summing up the topic of three nines – speaking from my experience, it is possible.
And so we got to the fourth nine and here...a surprise – I will not describe how to achieve it, because I can’t do it myself. 99,99% means less than 5 minutes unavailability in month, so a bit impossible. Unfortunately sometimes this is what the clients expect, if not 100% availability and, of course, for free. Such approach can be understood. However it is surprising that J2EE software suppliers promise not only four but even more nines! In their documentations they present wonderful scenarios, large charts, extended diagrams of various hardware, clusters and so on. What they promise, is for me nothing but an abstract idea.
Why then do I think that in practice it is impossible? Because even the best hosting centers provide nowadays the services with 99,95% availability, so they leave 21 minutes in reserve for breakdowns on their side. And yet we have to add the time for the breakdowns on our side. Therefore it is visible that not much can be done, even if the components are working on the level of 99,99% availability, so only a bit higher.
Let’s think how much would cost each of the successive nine? According to the calculations made in the USA, every next nine increases the costs of creating a system one time, and double annual costs of its maintaining. According to my personal calculations, this regularity works in case of the first three nines. Therefore the decision to make the system available is a business decision, preceded with detailed calculations. Each company should calculate individually, how much it can lose and how much it can save on the more available system.
And finally the summing up.
There is a very popular opinion that THIS cannot happen in our system, and the probability that THIS is going to happen is . There is nothing more wrong. Let's calculate this. In the medium internet system there are about 500 hits per second, each of the users downloading 10 elements – let's say there are flash, graphics etc. We have 3600 seconds in an hour, 24 hours in a day, 365 days in a year, and we maintain the system for 5 years, because it is the average lifespan of the internet system. The conclusion is that we have about 800 billions of chances that something may go wrong. In the Milky Way, according to the latest calculations, there is 400 billions of stars, so the big scale is very adequate here. This means that problems (the equivalents of the explosion of supernova) can happen every day.
The basic question is not what can happen but when it can happen. And we should be prepared for this. I hope I managed to present that in large systems we have to deal with really big problems, but there is also a great satisfaction when we are able to overcome them. I thing there is a lot of people with the experience as a developer, who will find such satisfaction solving problems in such systems. I am such a person.
Want to ask any questions? Write to:
Translation: Magdalena Rudny


Nobody has commented it yet.